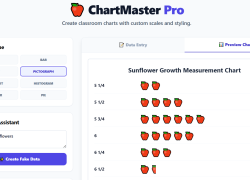
Easily create custom classroom charts. Students will analyze data, interpret graphs, and develop essential graphing skills across subjects like math, science, and social studies.
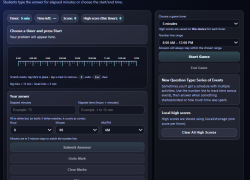
Students master elapsed time, start time, and end time by interacting with a visual number line. They solve engaging word problems and schedule challenges, building crucial time-telling skills.
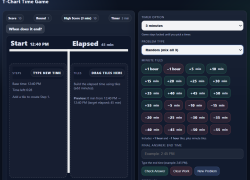
Students master elapsed time, start/end time, and intervals using an interactive T-chart model. They drag, drop, record steps, and build essential math fact fluency.
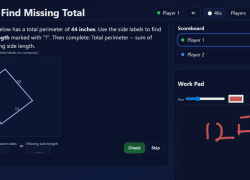
Students practice calculating perimeter by solving for unknown lengths or total distance around shapes. They build problem-solving skills, accuracy, and confidence with real-world scenarios.
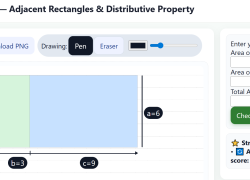
Students explore area concepts with an interactive tool. They calculate and combine adjacent rectangle areas to find total shapes, reinforcing multiplication and the distributive property.
Challenge students to design an Earth Science experiment. They will determine which sediment type exhibits the greatest porosity and permeability through hands-on investigation.
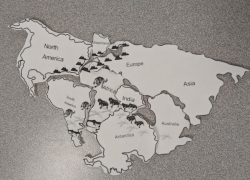
Students discover Alfred Wegener's evidence supporting Earth's changing continents and ancient supercontinent. They research fossils, climates, assemble a puzzle, and discuss findings.
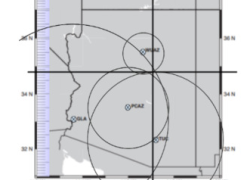
Students analyze seismogram data to triangulate earthquake epicenters. They calculate magnitudes, compare energy released, and understand seismic power, creating a professional press release.
Students will build their own barometers and track daily changes. They will observe how barometric pressure correlates with high and low-pressure systems and local weather.
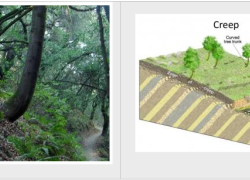
Students investigate mass movement types, their triggers, and prevention methods. They research significant landslides, exploring terms like erosion, deposition, and lahar.
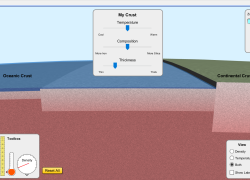
Students will explore plate tectonics, analyzing crust density and its impact on plate movement. They will compare oceanic and continental crust, predicting landform creation at various boundaries.
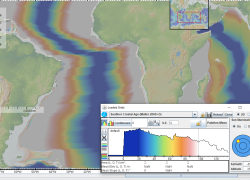
Students explore seafloor age with an online map, learning about Hess's work. They calculate spreading rates, discover age patterns, and investigate magnetic pole reversals.