📊 ChartMaster Pro is a powerful teacher tool designed to help educators create clear, engaging, and standards-aligned classroom charts with full control over chart type, scale, icons, labels, and styling.
Built specifically for classroom instruction, ChartMaster Pro makes it easy to create charts that students can read, analyze, and discuss—whether for math, science, social studies, or data talks.
🧠 What Teachers Can Create
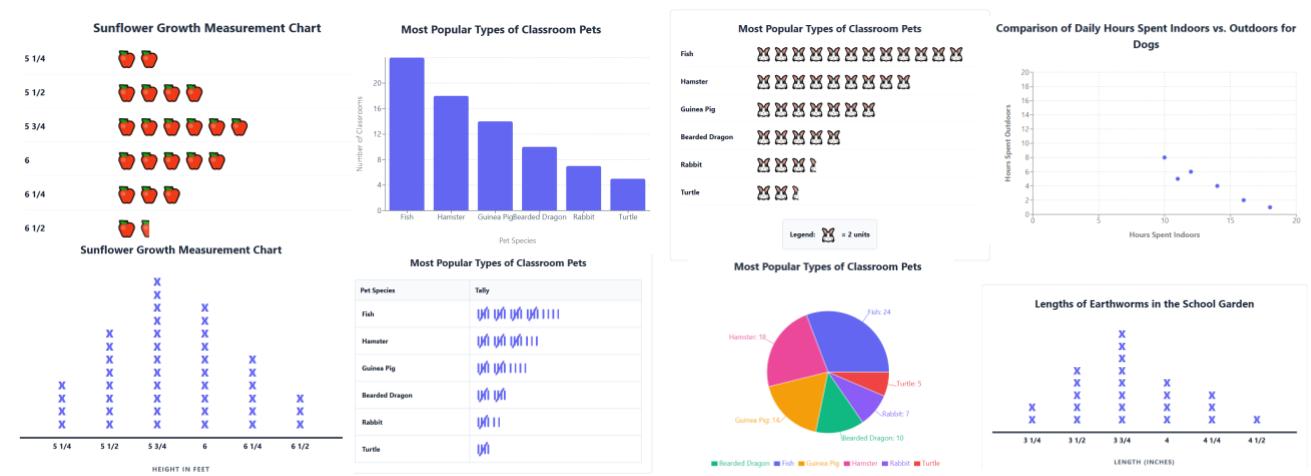
ChartMaster Pro allows teachers to build a wide variety of classroom charts, including:
-
Bar Charts
-
Line Graphs
-
Line Plots
-
Tally Charts
-
Histograms
-
Scatter Plots
-
Pie Charts
-
Pictographs (perfect for elementary math!)
Teachers can switch chart types with one click and instantly preview the results.
🤖 AI Data Assistant (Optional)
Need quick sample data or a starting point?
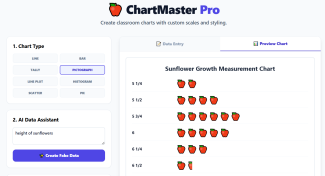
The AI Data Assistant can instantly generate fake data based on a short description (such as “height of sunflowers”). This is perfect for:
-
Modeling lessons
-
Whole-class examples
-
Practice charts
-
Warm-ups and math talks
Teachers can edit or replace the data at any time.
📐 Custom Scales, Labels & Pictograph Keys
ChartMaster Pro gives teachers full instructional control:
-
Create a custom chart title
-
Label the X-axis and Y-axis
-
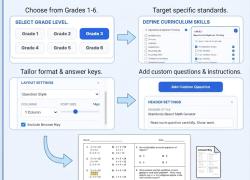
Set custom scales and intervals
-
Build pictograph keys by:
-
Choosing an icon (emoji or symbol)
-
Setting the value per icon (ex: 🍎 = 2 units)
-
-
Optionally show totals directly on the chart
This makes charts accurate, student-friendly, and aligned to grade-level standards.
🎨 Classroom-Ready Styling
Teachers can customize the look of each chart to match their classroom or lesson:
-
Choose a primary color
-
Select a font style
-
Create clean, distraction-free visuals
-
Design charts suitable for anchor charts, slides, or worksheets
👀 Live Preview While You Build
As teachers enter data or adjust settings, the chart updates instantly in the Preview Chart panel. This allows teachers to:
-
Catch mistakes quickly
-
Model revisions for students
-
Fine-tune visuals before exporting
📤 Export & Use Anywhere
Once a chart is complete, teachers can export it instantly as:
-
PNG (transparent background) — perfect for slides and digital lessons
-
JPG (white background) — great for printing and worksheets
Charts can be:
-
Printed
-
Added to slides
-
Posted in an LMS
-
Used year after year
⭐ Designed for Real Classrooms
ChartMaster Pro is ideal for:
-
Elementary math pictographs and line plots
-
Data analysis lessons
-
Science experiments
-
Classroom discussions
-
Student examples and modeling
It saves teachers time while producing high-quality, instruction-ready visuals students can actually understand.